Patient #1
This page shows some of the results of PET-guided and fused visualizations using the Patient #1 data set.
|
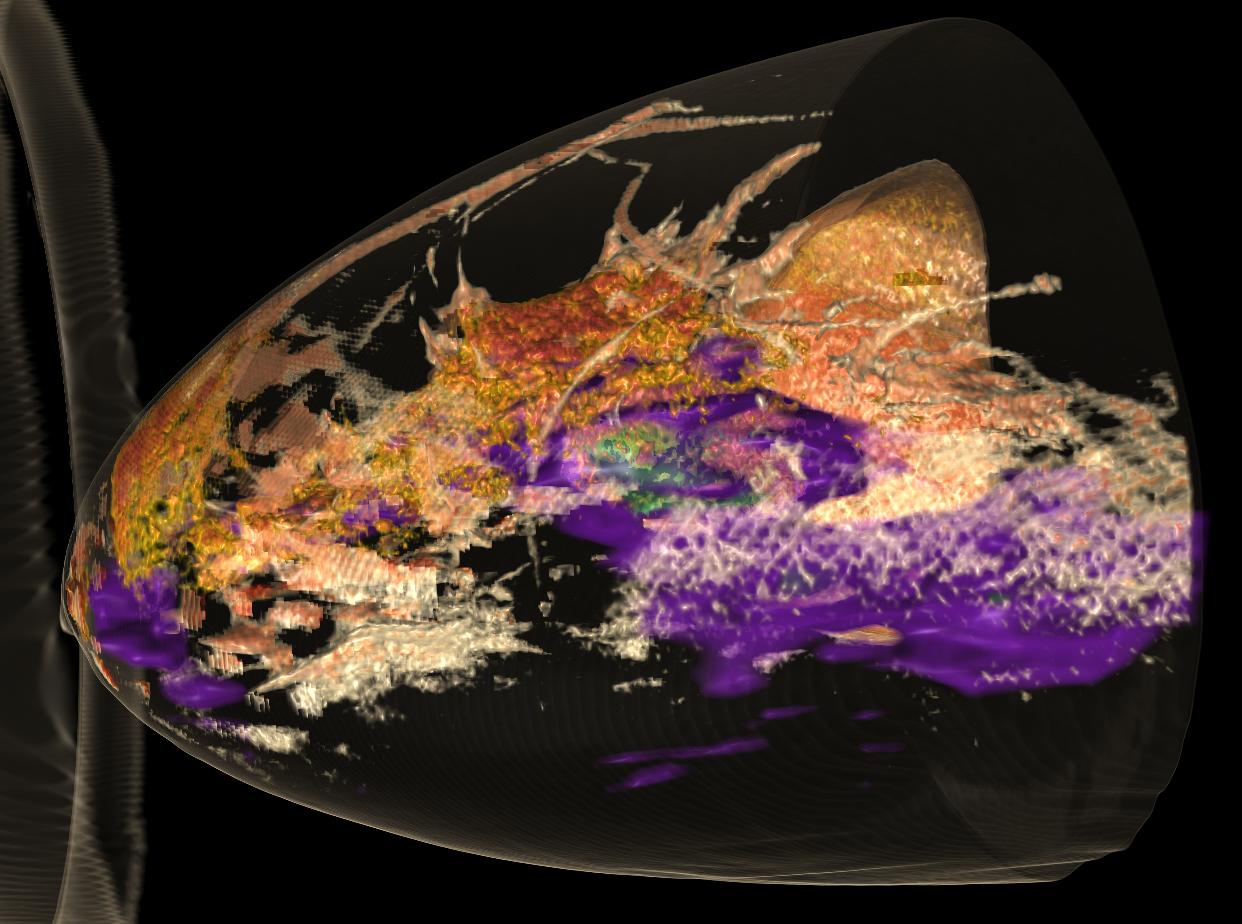
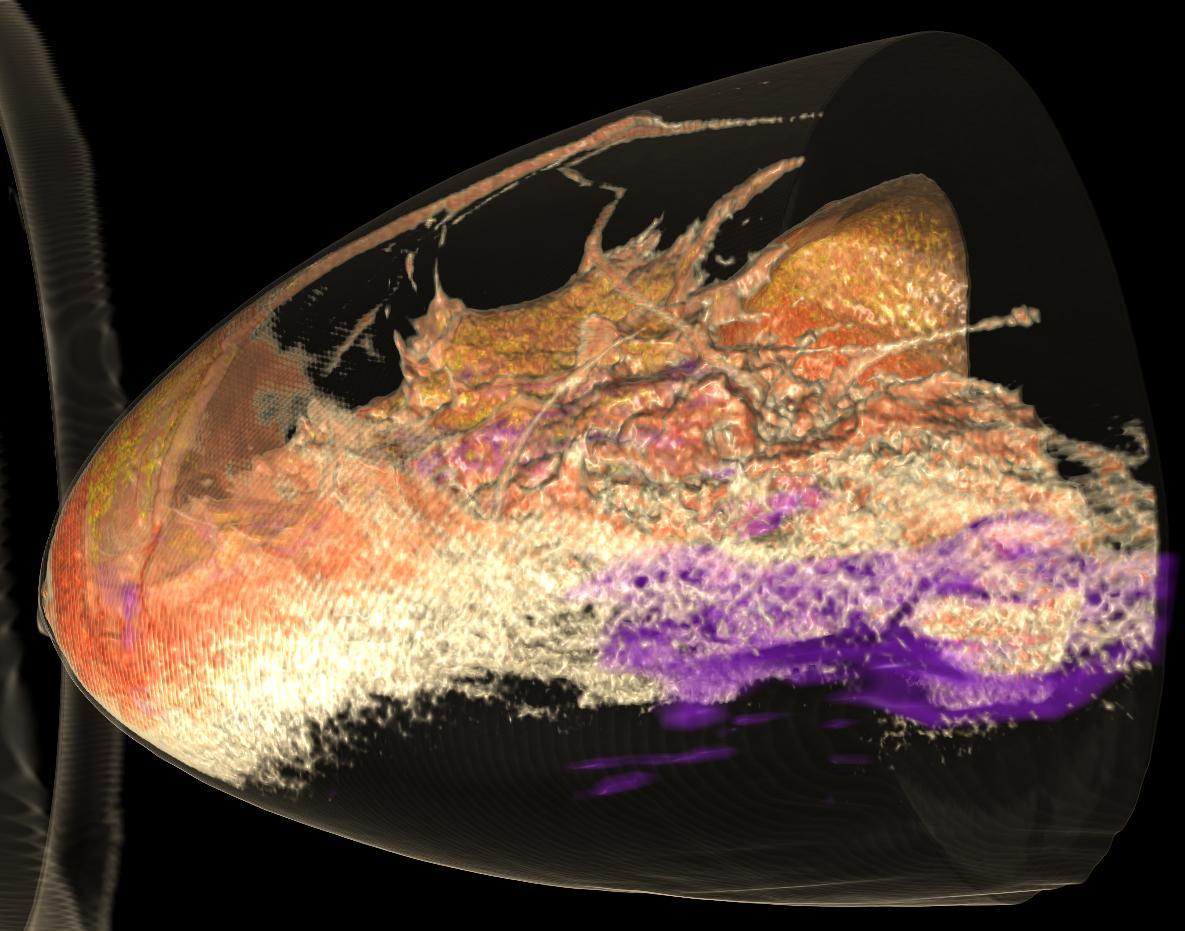
This fused image contains information from CT (reds and yellow) and PET (purple and green). There are two kinds of tumors in this dataset. One is DCIS (ductal carcinoma in situ), the other is benign. Only DCIS is visualized in the PET dataset. The vessels are preserved for context, while occluding tissue is removed. The purple area is where PET dataset indicates high rate of metabolic activity. |
Our visualization consists on two parts:
- PET-guided opacity, which only renders the CT images, but highlights the regions where there is also a high PET signal.
- Fused visualization, which combines both the CT and PET images. To do this, we define three color and opacity maps:
1. The following is the transfer function for CT dataset that's not included in the region of interest:

2. This is the transfer function for region of interest, i.e., where PET signal is high:

3. This is the transfer function for PET dataset:

Detailed Analysis:
Method 1: PET-guided Visualization
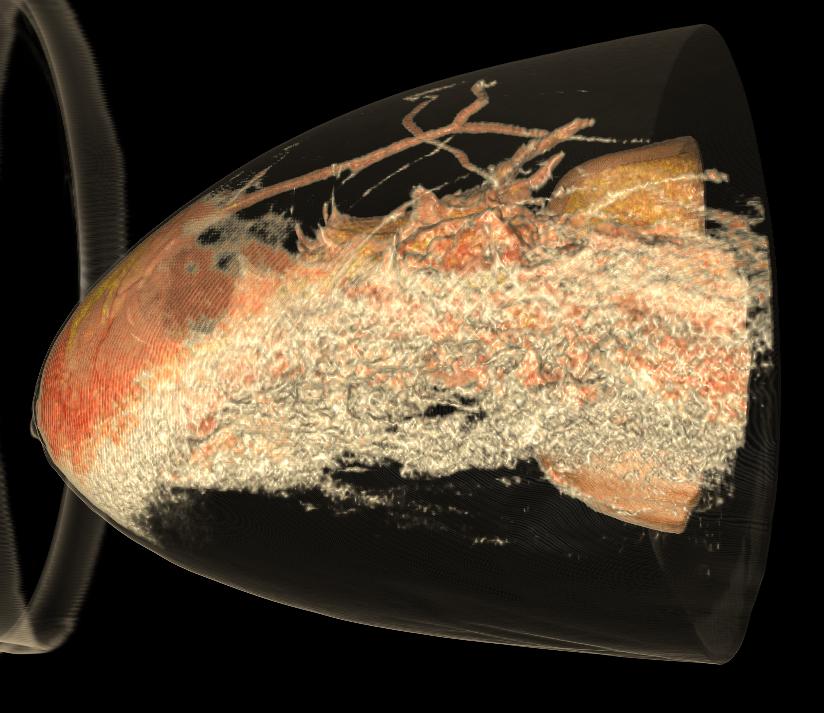
Step#1In the underlying image, the CT dataset is visualized in a traditional way. The PET image is not taken into account. This image highlights the vessels, but also carries a lot of noise and occlusing structures. The areas where the tumors lie in are not visible. |
Step#2Now we define a region of interest (ROI) based on the PET signal. Here, we only visualize CT, but we highlight those regions in CT where the PET signal is high, meaning a high rate of metabolic activity. Now we can see more of the tumors as occluding tissue (where PET signal is low) is made more transparent. |
Step#3We expand the ROIs further, i.e., increase the threshold on the PET signal that guides how much of the CT is visible. Much more of the tumors are exposed. At the same time, the information about how the tumor is related to the vessel is still preserved. |
||
|

|

|
||
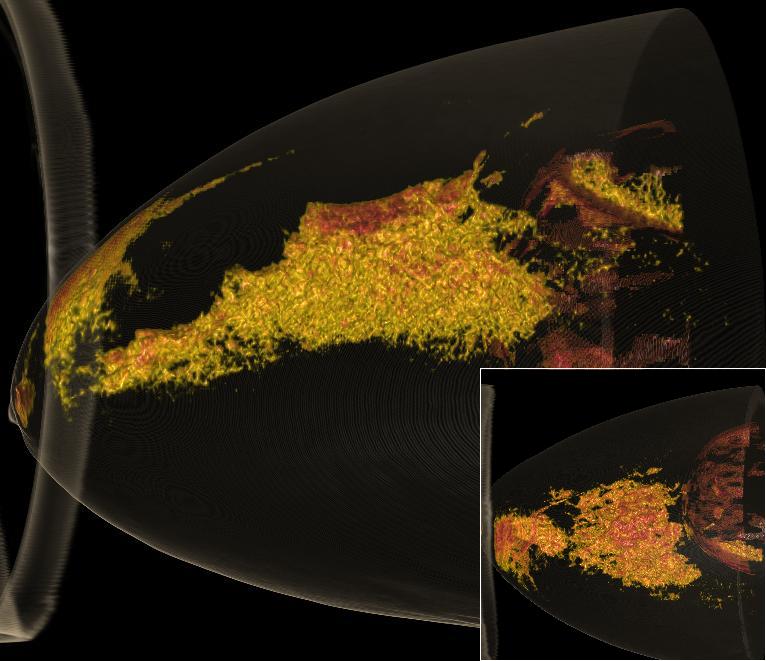
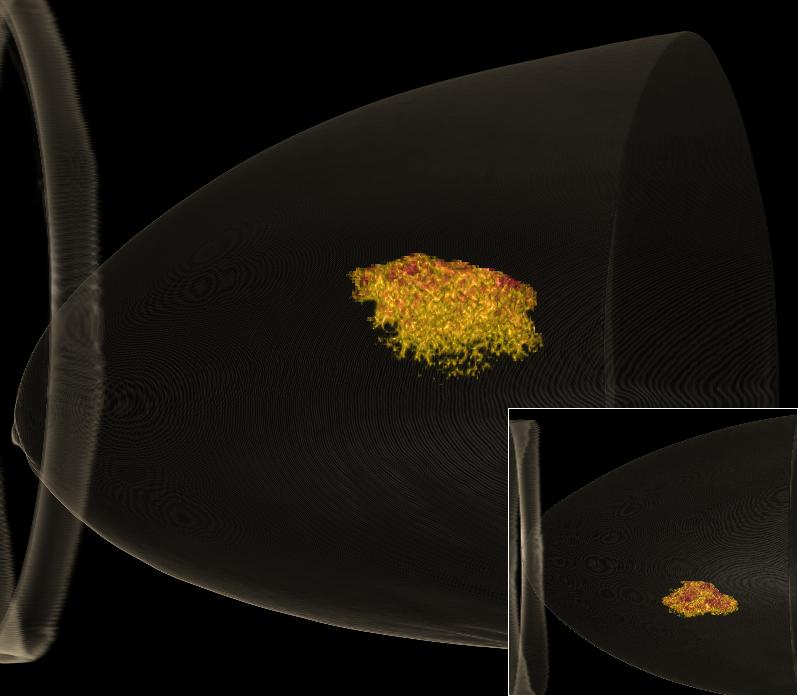
Step#4Now, we decrease the opacity of the context area (surrounding tissue) more transparent, so that we only see the ROI, which indicate the tumor, and the skin, for context Because the tumors have a similar intensity, it is hard to differentiate them merely based on CT dataset. But, using the PET signal as a guide, we can visualize them separately. In the picture in lower left quarter, the same volume is rotated downwards 90 degrees along the x axis (x axis is the horizontal line and y axis is the vertical line with respect to the screen). |
|
|||
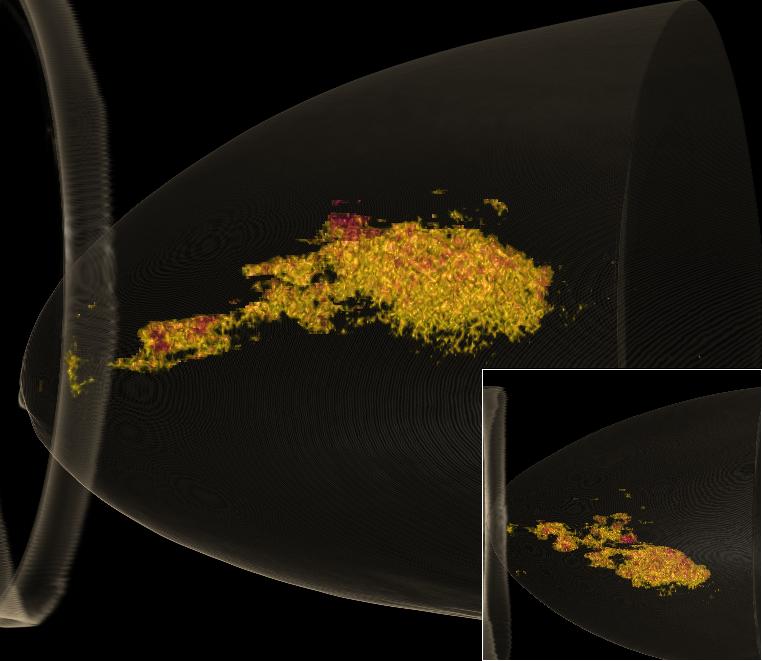
Step#5By reducing the ROI further, we can get part of the tumors. |
The following is an interactive demonstration of the effects of using a PET threshold to guide the rendering of the CT image. Only the regions where the PET signal is larger than this threshold are visible. Try it.
|
Step#6The ROI is further reduced. Only one tumor is now visible. |
||
|
|
|
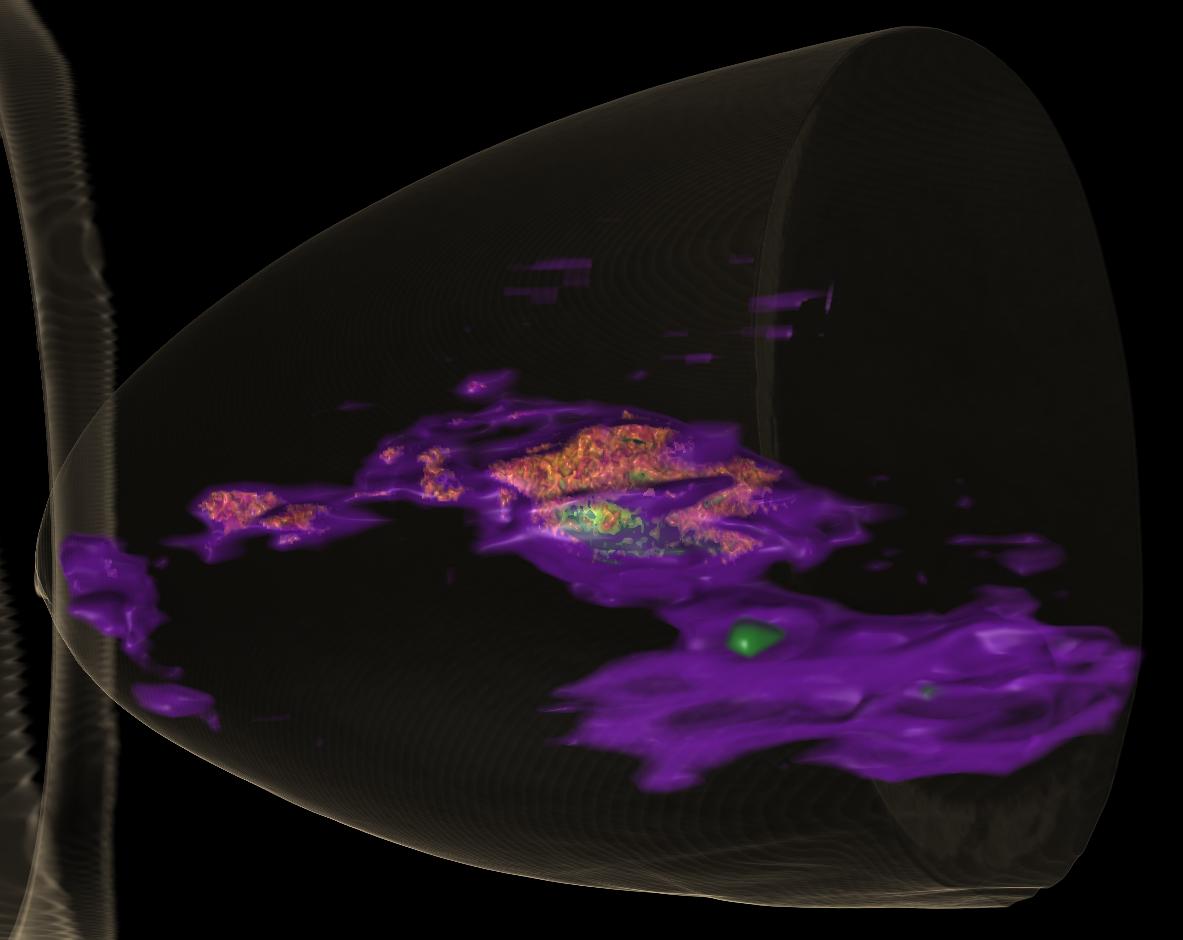
Method 2: Fused Visualization
These images show the result of fusing both the CT and PET images. By using the PET signal to guide the visualization, we can pin point more accurately the location of malign tumors. In the image in the bottom right corner, we see a portion of high PET signal, but no corresponding CT signal in the same intensities as the tumor. What does this mean?
|
No PET-guided visualization (i.e., it doesn't consider the spatial information from PET). |
PET-guided visualization (Considers the spatial information from PET) |
|
|
Keep context information (surrounding tissue) |
|
|
|
Remove context information (make surrounding tissue, except skin contour, invisible) |

|
|
MainNext